Photo of a problem with a graph or drawing:
how geometry and functions are recognized
 Automatic translate
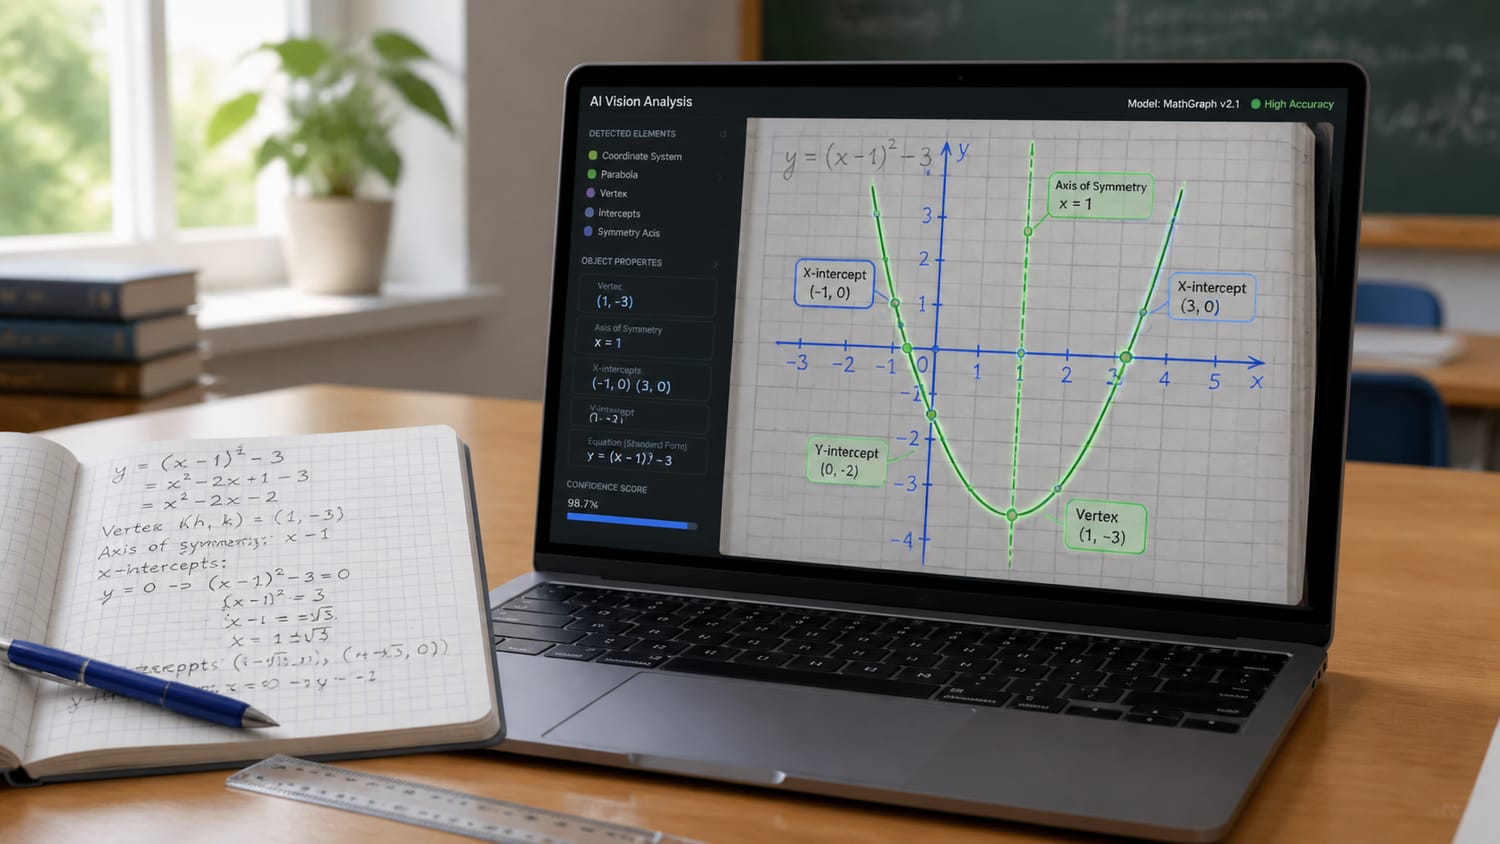
Photo problems involving graphs or drawings often require not only an answer but also a precise understanding of how AI recognizes geometry and functions in the image. In this article, we’ll explore how the program identifies lines, shapes, axes, and curves, as well as the most common errors encountered when processing such photos.
2 Recognizing geometric shapes: from lines to complex constructions
3 Reading function graphs: axes, curves, and intersection points
4 Computer vision technologies and neural networks at the core of recognition
5 Common recognition errors and how to avoid them when taking photos
6 From a recognized image to a ready-made solution to the problem
7 How recognition works in practice
How artificial intelligence "sees" a math problem in a photo
When a user uploads a photo with a task, the system first converts the image into a set of machine-readable features: contrasting lines, text, dots, arcs, axes, and captions. Computer vision then identifies individual elements in the image, and the neural network matches them to known patterns — for example, a coordinate plane, a figure drawing, or a function graph.
In practice, this isn’t "understanding" in the human sense, but rather sequential image processing: edge detection, character recognition, determining the relative positions of objects, and verifying the logic behind the construction. This is why a carefully placed photo with a level angle and good lighting significantly improves recognition accuracy.
Modern OCR and computer vision systems work particularly well when the task contains clear geometric shapes and contrasting text, but blurred lines and tilted frames dramatically reduce the quality of the result.
What exactly is analyzed in the image?
The algorithm typically looks for not just one feature, but several at once: line shape, object sizes, label placement, intersections, axis divisions, and repeating elements. If the task involves a graph, line curvature, position relative to the axes, and key points are also evaluated.
Recognizing geometric shapes: from lines to complex constructions
When processing a photo with a drawing, the system first looks for simple elements: line segments, angles, intersection points, and closed contours. From these basic features, it assembles more complex objects — triangles, quadrilaterals, circles, and their combinations.
The algorithm is more concerned with the structure of a shape than with its name : how many sides the contour has, where the vertices are, whether there are parallel lines, equal segments, and additional notations. Therefore, even a slightly distorted image can be recognized as long as the basic geometric relationships remain legible.
- Circuit
- A closed line by which the system determines the boundaries of a figure.
- Vertex
- The point at which the sides or rays of a geometric object converge.
- Comparison of features
- The process by which a program compares found elements with shape templates.
In complex constructions with auxiliary lines and marks, recognition becomes a multi-step process: first, the main shapes are identified, then the relationships between them are verified. This is why the same figure in a neat drawing is identified more quickly and accurately than in a photograph with a shadow, highlight, or a strong tilt.
In geometry problems, errors often arise not from the figure itself, but from the fact that parallelism, proportions, or small notations are lost in the photograph.
Why are complex structures more difficult to recognize?
If a drawing contains many intersecting lines, the algorithm must separate the necessary elements from the auxiliary ones. The more overlapping, small labels, and irregular angles, the higher the risk that some features will be interpreted incorrectly.
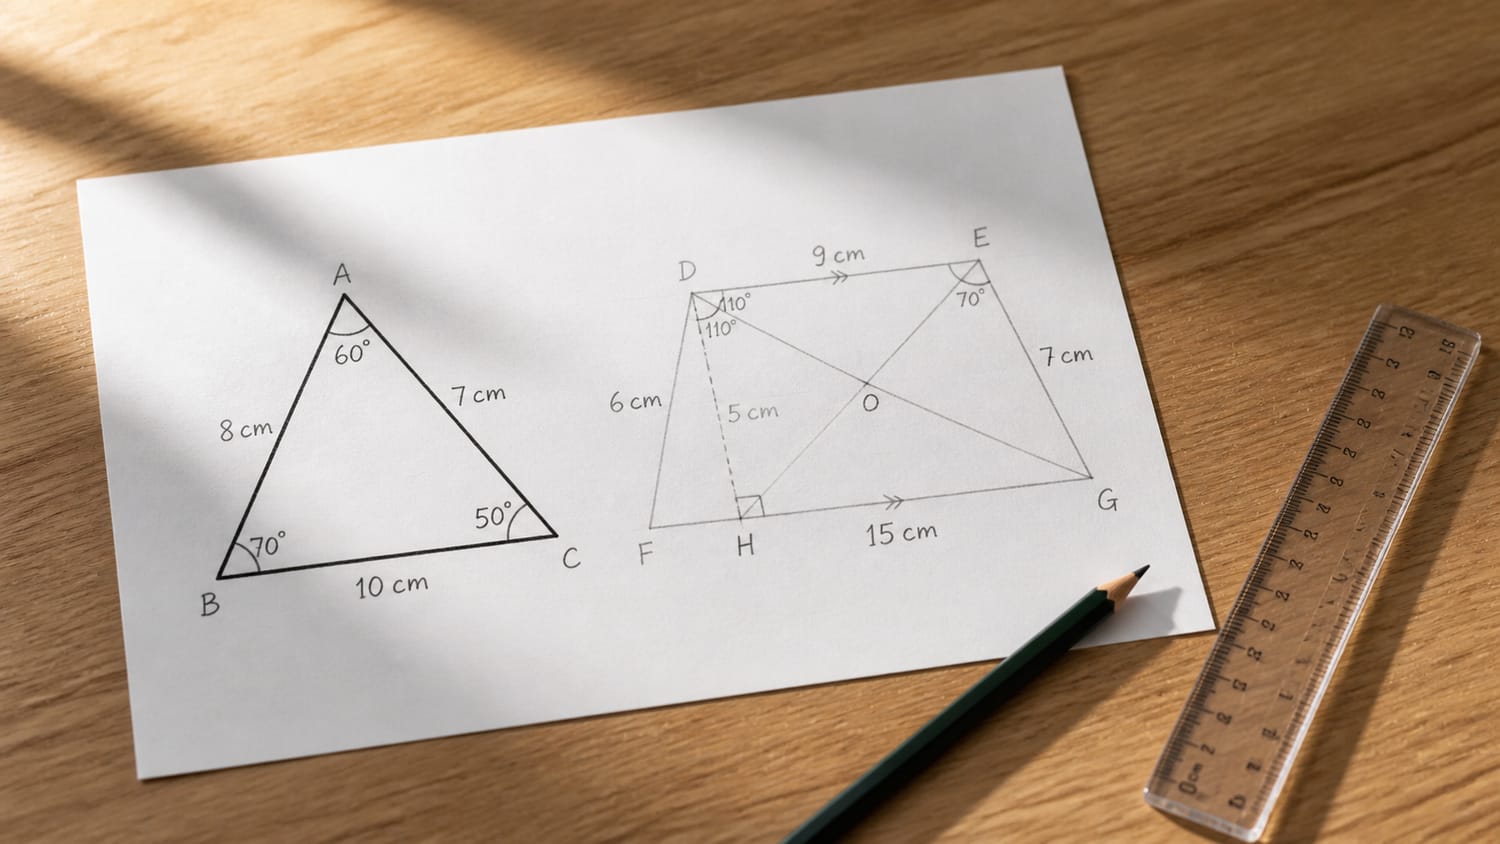
How does an algorithm distinguish a triangle from a trapezoid in a drawing?
To distinguish between a triangle and a trapezoid , the system first finds a closed contour and counts its sides, vertices, and angles. A triangle always has three sides, while a trapezoid has four, with one pair of sides usually parallel.
In a drawing, the algorithm doesn’t rely solely on visual inspection of the shape: it checks geometric features, line segment lengths, and the relative positions of lines. If the figure is photographed at an angle or some lines are poorly visible, the program may make errors, so clear boundaries and contrasting markings are essential.
- The number of sides helps to quickly weed out unnecessary options.
- Parallelism of the sides is especially important for recognizing a trapezoid.
- Intersection points and angles clarify the type of figure if the outline is not perfect.
In computer vision, a shape is determined not by a single feature, but by a combination of features: contour, angles, aspect ratio, and line arrangement work together.
Why identical figures can be recognized differently
If a triangle is partially obscured, or if one side of a trapezoid is barely visible, the algorithm has a harder time reconstructing the full shape. It then compares the detected elements with templates and selects the most likely interpretation.
Reading function graphs: axes, curves, and intersection points
When a user photographs a problem with a graph, the algorithm first identifies the coordinate system and basic elements of the image. It then recognizes coordinate axes , function curves , and key points — these are what allow us to reconstruct the mathematical relationship.
The main task is to convert image pixels into numerical data: coordinates, curve shape, and relative positions of objects. Computer vision and edge analysis methods are used for this purpose.
- Coordinate axes
- Straight lines, usually intersecting at 90°, that define a frame of reference.
- Function curve
- A line (smooth or broken) that shows the relationship between variables.
- Intersection points
- Key coordinates where the graph intersects axes or other graphs.
The recognition process can be roughly divided into stages:
- Extraction of straight lines (search for axes using the Hough detector).
- Determining the scale and markings (grid step, labels).
- Curve segmentation is the separation of a graph line from its background.
- Approximation of shape (for example, determining whether it is a parabola or a line).
- Search for characteristic points: intersections, extremes, breaks.
Even a simple school schedule contains a lot of hidden information : line thickness, color, the presence of a grid — all of this is taken into account by the algorithm.
- Thick lines require smoothing before analysis.
- Colored graphs can contain multiple functions.
- Blurry photos make it difficult to highlight intersection points.
- Axles
- What is extracted: Position and angle
- Why is this necessary: Defining a coordinate system
- Curve
- What is extracted: Form and equation
- Why is this necessary: Understanding the function type
- Intersections
- What is extracted: Point coordinates
- Why do you need it: Solving equations and analyzing graphs
According to research in the field of computer vision, the accuracy of determining the shape of a graph with good image quality can exceed 90%.
How is the type of a function determined?
The algorithm compares the curve’s shape to typical models: a straight line, a parabola, and an exponential curve. Approximation and machine learning methods are used to select the most probable formula.After recognizing all the elements, the system can already interpret the graph: find the equation, determine the behavior of the function, and use this data to solve the problem.
Working with the coordinate grid and image scale
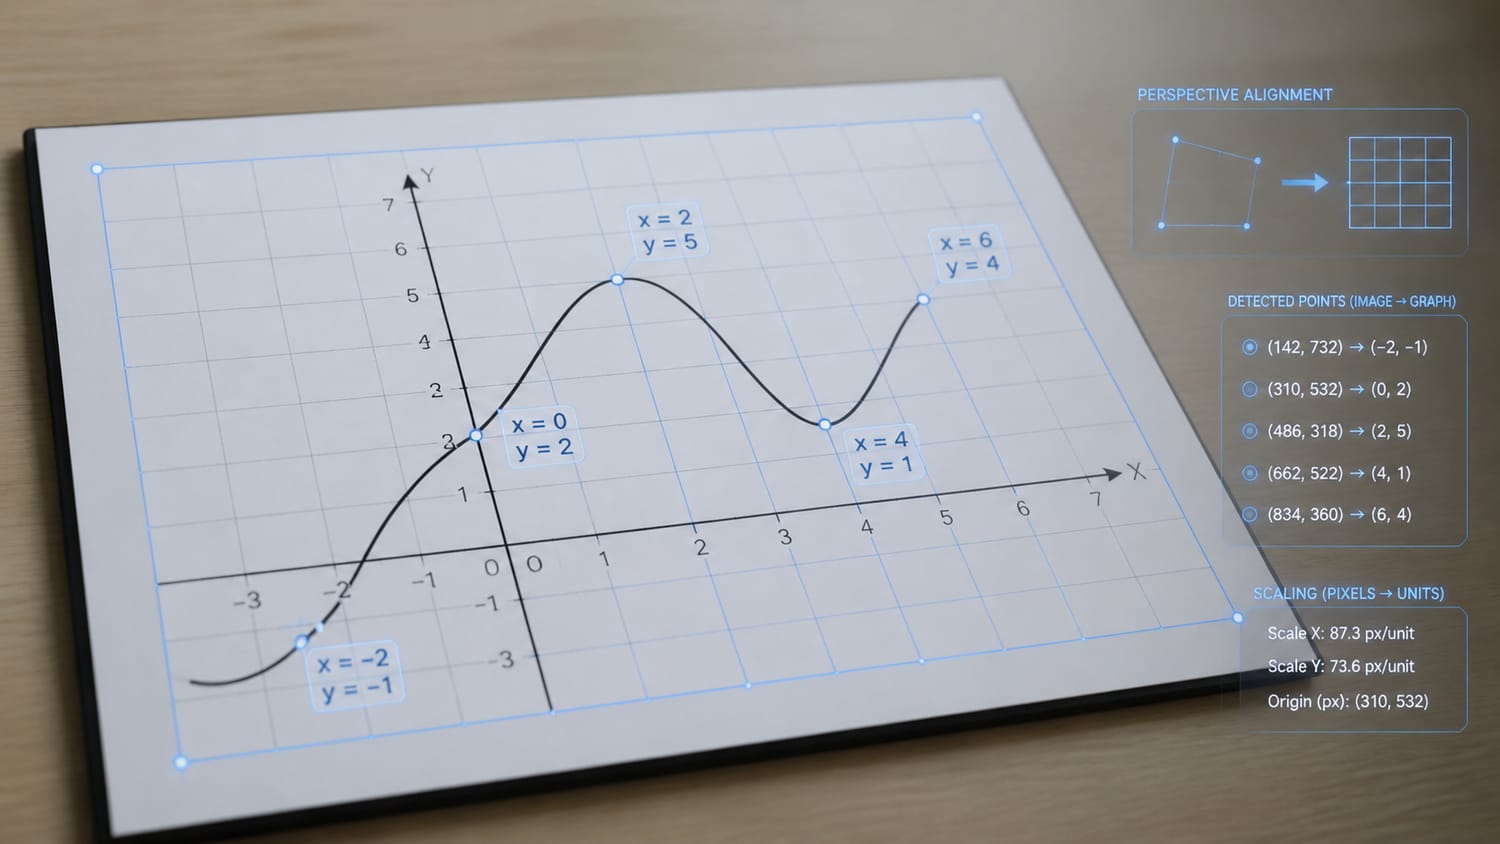
After selecting the graph, the algorithm analyzes the coordinate grid — a regular grid that helps convert the image into numerical form. The grid determines the image scale and allows for precise determination of the coordinates of points on the graph.
The key challenge is that the grid in a photo can be distorted: the lines are slanted, and the intervals are uneven due to perspective. Therefore, the algorithms first "straighten" the image and restore uniformity to the divisions.
- Coordinate grid
- A system of horizontal and vertical lines that defines the step of changing coordinates.
- Scale
- The relationship between the distance in the image and the actual coordinate values.
The scale is determined by several criteria:
- Distance between grid lines.
- Axis labels (e.g. 1, 2, 5, 10).
- Location of the origin.
The system then converts pixel coordinates into mathematical values:
- Determines the grid spacing along the X and Y axes.
- Finds the point (0,0) or its position in the image.
- Constructs a transformation: pixels coordinates.
- Applies this transformation to all points on the graph.
Even a small error in scale can lead to an incorrect solution to the problem , so this step is critically important.
- Image tilt
- Reason: Photo taken at an angle
- Algorithm solution: Geometric alignment
- Uneven grid
- Reason: Perspective distortion
- Algorithm Solution: Perspective Correction
- No signatures
- Reason: Cropped photo
- Algorithm solution: Estimating scale by distances
In computer vision tasks, correct scale restoration can improve coordinate recognition accuracy by more than 30%.
What happens if there is no grid?
If there is no coordinate grid, the algorithm relies on the axes and characteristic points of the graph. In this case, approximation methods and assumptions about the function type are used, but accuracy may decrease.After calibrating the scale, the system receives the exact coordinates of all graph elements, which allows one to proceed to the mathematical analysis of the function.
Computer vision technologies and neural networks at the core of recognition
The recognition of graphs and drawings is based on computer vision — a field of artificial intelligence that analyzes images and extracts structure from them. Algorithms don’t "see" images like humans, but rather transform them into a set of numbers, contours, and features that are used to make decisions.
Modern systems actively use neural networks trained on thousands and millions of images. They are capable of recognizing lines, shapes, symbols, and even complex graphs, given the context of the task. Particularly important is the model’s ability to generalize — to correctly interpret even imperfect or partially distorted images.
Such technologies underlie services that allow you to receive answers from a photograph of an assignment , automatically analyzing graphs and formulas.
- Computer vision
- A set of algorithms for analyzing and understanding images.
- Neural network
- A machine learning model that mimics the functioning of the human brain.
The main technologies used in recognition:
- Convolutional neural networks (CNN) – for image analysis and feature extraction.
- Object detection algorithms - for searching for lines, points and symbols.
- OCR (Optical Character Recognition) – for reading signatures and numbers.
- Segmentation methods - to separate the graph from the background.
The image processing process usually looks like this:
- Pre-processing: noise reduction, contrast enhancement.
- Highlighting key elements (axes, lines, text).
- Classification of objects (e.g. graph type).
- Interpretation of data and translation into mathematical form.
Each stage enhances the accuracy of the next , forming a chain of analysis from pixels to meaning.
- CNN
- Task: Image analysis
- Result: Feature extraction
- OCR
- Task: Text recognition
- Result: Reading numbers and signatures
- Segmentation
- Task: Separation of objects
- Result: A clean, noise-free graph
According to experts, the use of neural networks increases the accuracy of mathematical image recognition by 20–40% compared to classical algorithms.
Why neural networks are better than classical methods
Classic algorithms operate according to preset rules, while neural networks are trained using data. This allows them to adapt to different image styles, handwriting, and photo quality.It is the combination of these technologies that allows the system not only to “see” the graph, but to understand its mathematical meaning .
Common recognition errors and how to avoid them when taking photos
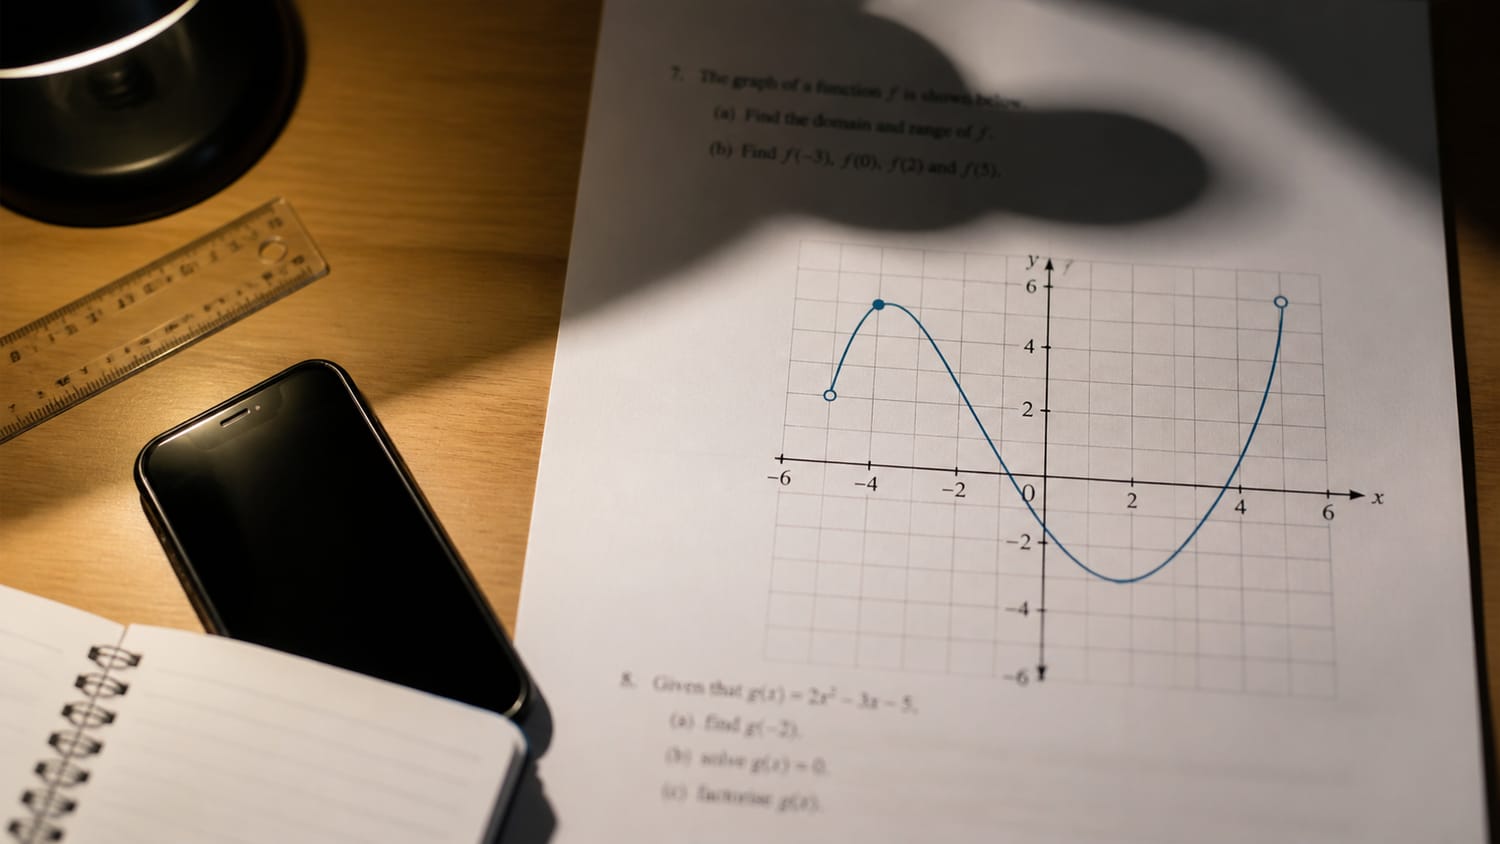
Even the most advanced computer vision algorithms can make mistakes if the original image is of low quality. Recognition errors are most often related not to the algorithm itself, but to shooting conditions: lighting, camera angle, and image clarity.
The main problem is distortion of the source data. If a graph or drawing is difficult for a human to see, the neural network will also have difficulty correctly identifying lines, text, and key points.
- Image noise
- Random distortions (graininess, pixels) that interfere with analysis.
- Perspective distortion
- Change in the shape of objects due to shooting at an angle.
The most common mistakes:
- Blurred image - graph lines become fuzzy.
- Strong tilt - the coordinate system is distorted.
- Poor lighting - details and contrast are lost.
- Partially cropped graph - important elements are missing.
- The presence of foreign objects interferes with segmentation.
To avoid problems, it is recommended to follow basic shooting rules:
- Keep the camera parallel to the surface of the sheet.
- Provide uniform lighting without shadows.
- Focus on the image before shooting.
- Capture the entire graph.
- Avoid glare and reflections.
Even a small improvement in photo quality can significantly improve recognition accuracy .
- Blur
- How it affects: Loss of contours
- How to fix: Use autofocus
- Incline
- How it affects: Distortion of coordinates
- How to fix: Shoot strictly from above
- Shadows
- How it affects: Hides elements
- How to fix: Add lighting
According to estimates by recognition system developers, up to 60% of errors are related to the quality of the original image, rather than to the algorithms.
Why Algorithms Don’t Always "Correct" Errors
Although modern models can correct distortions, they have a limit. In the case of severe blurriness or missing data, it is impossible to restore the original information without loss.A high-quality photo is the first and most important step to accurate recognition and the correct solution to the problem.
Tips for a sharp photo: lighting, angle, image quality
The quality of the original image directly impacts recognition accuracy. A clear image allows algorithms to accurately identify lines, text, and coordinates without additional corrections.
Lighting is a key factor. It’s best to use diffused light without harsh shadows: it evenly illuminates the graph and maintains the contrast between the lines and the background.
- Avoid shooting in low light conditions as noise will appear.
- Don’t use flash close up - it creates glare.
- Daylight or a lamp with soft lighting is preferable.
The shooting angle also plays a crucial role. The camera should be positioned strictly perpendicular to the surface of the sheet to avoid geometric distortion.
- Place your phone directly above the task.
- Make sure that the edges of the sheet are parallel to the edges of the frame.
- Do not tilt the device while shooting.
Image quality is determined not only by resolution but also by camera stability. Even the slightest movement can blur text and lines.
- Use autofocus before shooting.
- Hold the device still or use a support.
- Check the sharpness before submitting the image.
- Lighting
- Bad result: Shadows, highlights
- Good result: Uniform light
- Perspective
- Bad result: Shape distortion
- Good result: Shooting from above
- Focus
- Bad result: Blurry
- Good result: Clear lines
Experience shows that improving shooting conditions can increase recognition accuracy by more than 2 times without changing the algorithms.
Why is it important to check photos before sending?
Even if the image appears normal, zooming in may reveal blurriness or noise. Checking the image allows you to troubleshoot the issue early and avoid mistakes in your solution.The higher the quality of the original photo, the fewer “guesses” the algorithm has to make , which means the higher the accuracy of the result.
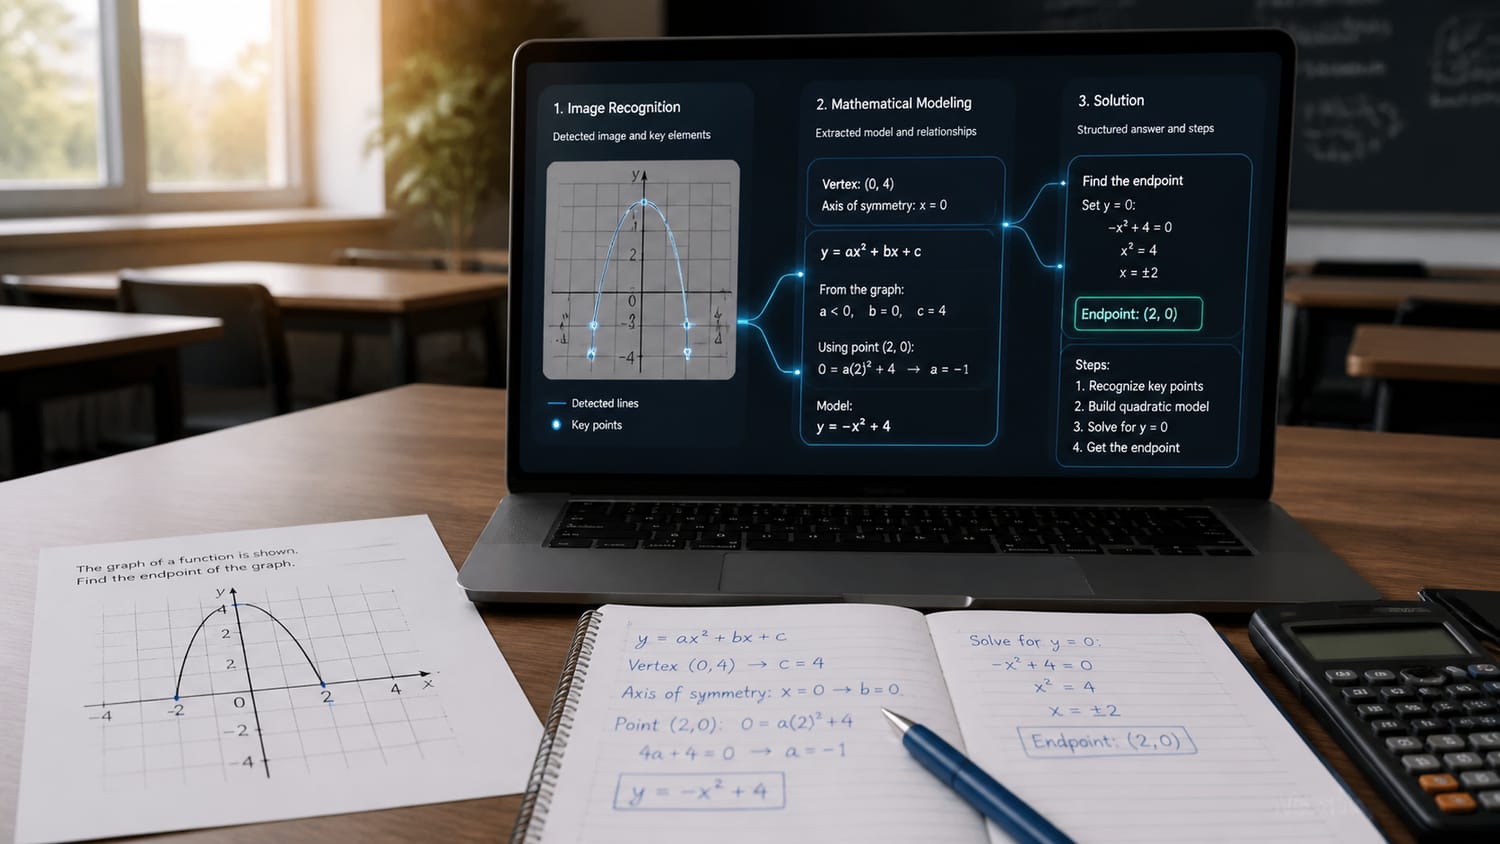
From a recognized image to a ready-made solution to the problem
Once the image is processed, the key stage begins: data interpretation . The algorithm transforms the detected elements (lines, points, and signatures) into a mathematical model: equations, coordinates, and relationships between quantities.
Essentially, the system "translates" the image into the language of mathematics , which is then used by computational algorithms. This allows for the application of standard solution methods: from simple calculations to complex function analysis.
- Mathematical model
- Formalized representation of a problem in the form of equations and data.
- Interpretation
- The process of converting visual information into numerical and logical form.
A typical solution process looks like this:
- Constructing a model (for example, a function equation based on a graph).
- Definition of the problem (find roots, maximum, area, etc.).
- Application of mathematical methods of solution.
- Checking the result for compliance with the original data.
It is important that the algorithm not only recognizes the image, but also understands the context of the task : where to find the intersection point, and where to analyze the behavior of the function.
- For graphs, the function’s zeros, extrema, and increasing intervals are calculated.
- For geometry, lengths, angles, and areas are determined.
- For text problems, the conditions are analyzed and a solution plan is developed.
- Recognition
- What’s happening: Selecting elements
- Result: Data (coordinates, lines)
- Modeling
- What’s happening: Building equations
- Result: Mathematical notation
- Solution
- What’s Happening: Calculations
- Result: Answer to the problem
Modern systems are capable of automatically solving up to 80–90% of standard school problems with correct recognition of the source data.
What happens when tasks are complex?
If a task requires a non-standard approach, the system can offer a step-by-step solution or several options based on trained models and example databases.The result of the work is not just a recognized image, but a ready-made solution with explanations that can be used for testing or training.
How recognition works in practice
Modern systems based on computer vision and neural networks can transform photo problems step by step into a comprehensible mathematical model: from identifying lines and shapes to analyzing graphs and calculating results. The accuracy of such recognition directly depends on the quality of the image and the correct interpretation of elements — be they geometry or functions. Understanding these processes helps not only better utilize technology but also avoid common shooting errors. As a result, the user receives not just recognized text, but a comprehensive solution based on an analysis of the problem structure .
Try applying these recommendations in practice and evaluate how recognition accuracy changes with a high-quality photo.